

Covid effect on energy consumption and CO2 emissions
09/08/21 15:36
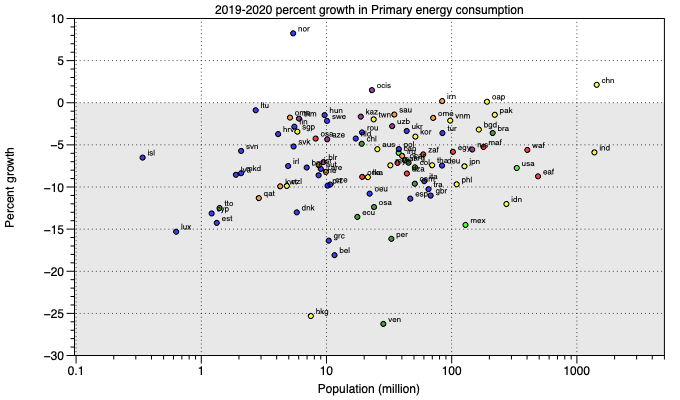
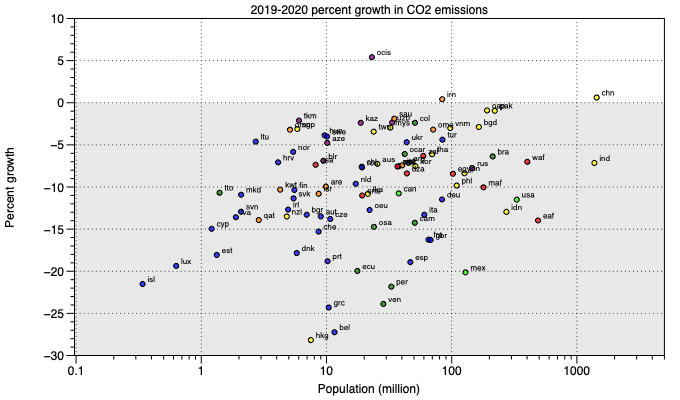
So, how did the covid pandemic affect the world's energy consumption and CO2 emissions? The plots below show the 2019-2020 percentage growth in primary energy consumption (top) and CO2 emissions (bottom) of countries in the BP statistical review of world energy database. The countries are coloured according to regions. Red is Africa, yellow is Asia Pacific, purple is CIS countries, blue is Europe, orange is Middle East, light green is North America, and dark green is Central and South America.
Although covid contributed to a dramatic reduction of energy consumption and CO2 emissions, it is interesting to see that this reduction was not the same everywhere. Countries with population > 100 million had reductions of less than 15% (with the exception of Mexico). China had a 2% increase in energy consumption and 0.6% increase in CO2 emissions, while India and USA had significant reductions of both energy consumption and CO2 emissions. Hong Kong and Venezuela which experienced a tough 2020 show reductions of 25-30%. Norway (nor) is interesting because although CO2 emissions decreased about 6%, primary energy consumption increased about 8%. Perhaps Norway lowered its CO2 footprint by exporting less hydrocarbons, but it consumed more energy because people stayed and worked from home?
Although covid contributed to a dramatic reduction of energy consumption and CO2 emissions, it is interesting to see that this reduction was not the same everywhere. Countries with population > 100 million had reductions of less than 15% (with the exception of Mexico). China had a 2% increase in energy consumption and 0.6% increase in CO2 emissions, while India and USA had significant reductions of both energy consumption and CO2 emissions. Hong Kong and Venezuela which experienced a tough 2020 show reductions of 25-30%. Norway (nor) is interesting because although CO2 emissions decreased about 6%, primary energy consumption increased about 8%. Perhaps Norway lowered its CO2 footprint by exporting less hydrocarbons, but it consumed more energy because people stayed and worked from home?