
IEA net zero by 2050 report
31/05/21 14:22
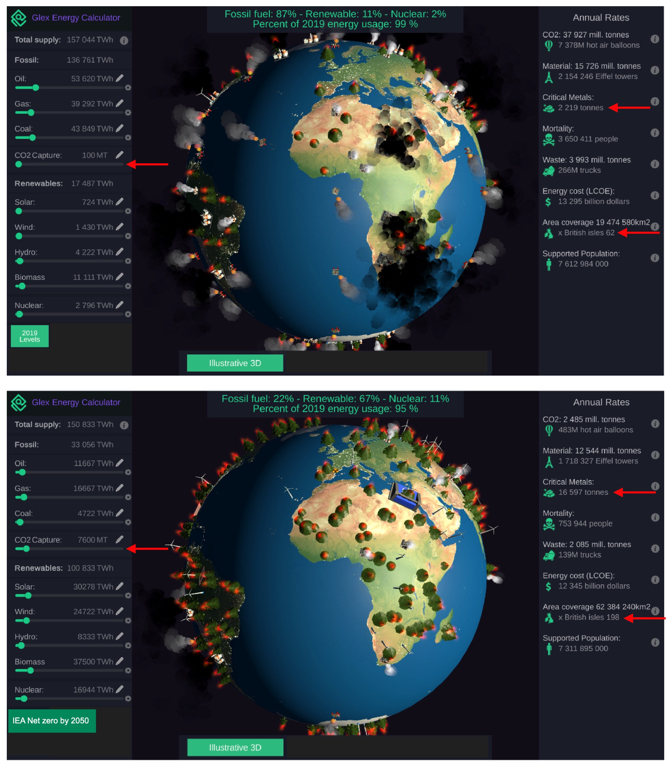
A comparison of today's energy mix (top) and the IEA net zero by 2050 mix (bottom). I used the IEA report and the Glex energy calculator to make this figure. The red arrows show some challenges: 76 times CO2 sequestration, 8 times critical metals, and 3 times use of land area by 2050. Notice that the IEA 2050 scenario meets the demands of a slightly smaller population than today's at the current energy consumption per capita. Obviously, we expect a larger population in 2050 (though population growth rate is decreasing), but IEA is also including in their scenario behavioural changes that will lead to less energy consumption per capita. Let's hope this is the case!