
Structural Geology Lectures
28/02/24 16:14
Sharing is caring :) I have posted the lectures of my course Structural Geology on the following YouTube playlist. I ask the students to watch these lectures before meeting to the class. That way we can concentrate on solving exercises in the class. That worked better than the standard lecture format, but it is still challenging. Sometimes the students don't have time to watch the movies, and some of the material is rather hard and requires watching the movie several times. But in any case, the movies can also be a way to study and review the material. Feel free to use these movies in your own teaching
Covid effect on energy consumption and CO2 emissions
09/08/21 15:36
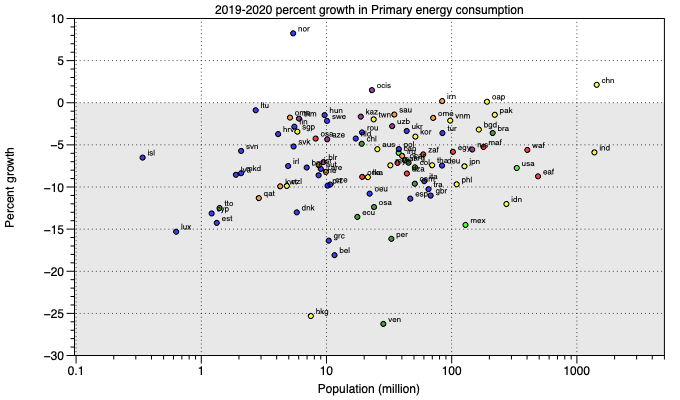
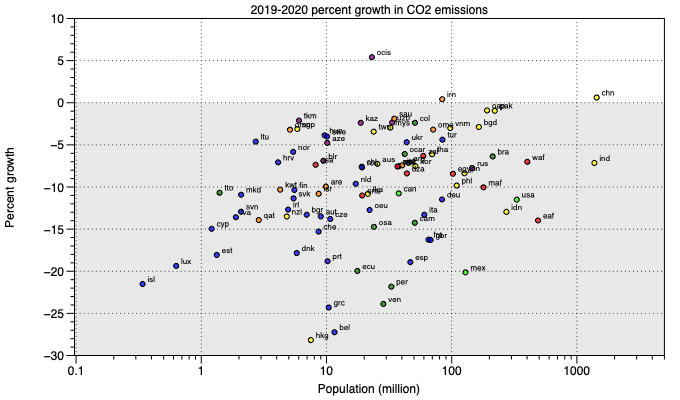
So, how did the covid pandemic affect the world's energy consumption and CO2 emissions? The plots below show the 2019-2020 percentage growth in primary energy consumption (top) and CO2 emissions (bottom) of countries in the BP statistical review of world energy database. The countries are coloured according to regions. Red is Africa, yellow is Asia Pacific, purple is CIS countries, blue is Europe, orange is Middle East, light green is North America, and dark green is Central and South America.
Although covid contributed to a dramatic reduction of energy consumption and CO2 emissions, it is interesting to see that this reduction was not the same everywhere. Countries with population > 100 million had reductions of less than 15% (with the exception of Mexico). China had a 2% increase in energy consumption and 0.6% increase in CO2 emissions, while India and USA had significant reductions of both energy consumption and CO2 emissions. Hong Kong and Venezuela which experienced a tough 2020 show reductions of 25-30%. Norway (nor) is interesting because although CO2 emissions decreased about 6%, primary energy consumption increased about 8%. Perhaps Norway lowered its CO2 footprint by exporting less hydrocarbons, but it consumed more energy because people stayed and worked from home?
Although covid contributed to a dramatic reduction of energy consumption and CO2 emissions, it is interesting to see that this reduction was not the same everywhere. Countries with population > 100 million had reductions of less than 15% (with the exception of Mexico). China had a 2% increase in energy consumption and 0.6% increase in CO2 emissions, while India and USA had significant reductions of both energy consumption and CO2 emissions. Hong Kong and Venezuela which experienced a tough 2020 show reductions of 25-30%. Norway (nor) is interesting because although CO2 emissions decreased about 6%, primary energy consumption increased about 8%. Perhaps Norway lowered its CO2 footprint by exporting less hydrocarbons, but it consumed more energy because people stayed and worked from home?
IEA net zero by 2050 report
31/05/21 14:22
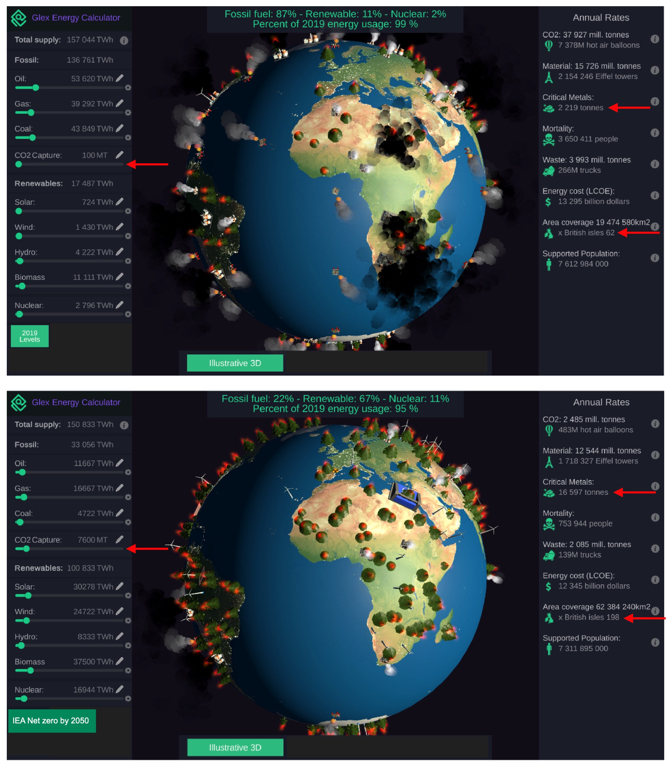
A comparison of today's energy mix (top) and the IEA net zero by 2050 mix (bottom). I used the IEA report and the Glex energy calculator to make this figure. The red arrows show some challenges: 76 times CO2 sequestration, 8 times critical metals, and 3 times use of land area by 2050. Notice that the IEA 2050 scenario meets the demands of a slightly smaller population than today's at the current energy consumption per capita. Obviously, we expect a larger population in 2050 (though population growth rate is decreasing), but IEA is also including in their scenario behavioural changes that will lead to less energy consumption per capita. Let's hope this is the case!
Applicants to geology and petroleum programs
16/05/16 12:35
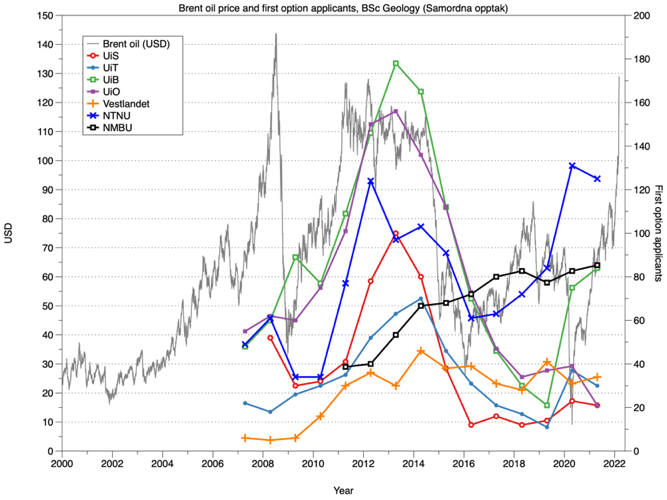
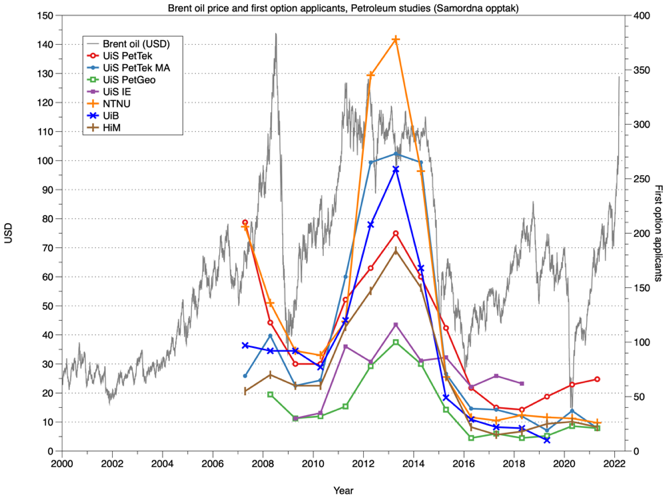
The plots below show the number of first-option applicants versus the oil (Brent) price (USD) for undergraduate programs in Norway in geology (top) and petroleum (bottom). Notice that from 2020, it has been difficult to track applicants since most programs changed their name from "petroleum" to "energy", and some closed or merged with other programs. Oil and gas prices have skyrocketed, yet applicants to petroleum programs remain low.